![typography brochure data visualisation data visualization editorial graphic design infographic information design Layout map](https://mir-s3-cdn-cf.behance.net/project_modules/1400/8091bc359139.6545a45cdad82.jpg)
![typography brochure data visualisation data visualization editorial graphic design infographic information design Layout map](https://mir-s3-cdn-cf.behance.net/project_modules/1400/7c94a8359139.6545a45cdc9e7.jpg)
![typography brochure data visualisation data visualization editorial graphic design infographic information design Layout map](https://mir-s3-cdn-cf.behance.net/project_modules/1400/4b72af359139.6545a45cde968.jpg)
![typography brochure data visualisation data visualization editorial graphic design infographic information design Layout map](https://mir-s3-cdn-cf.behance.net/project_modules/1400/18e7db359139.6545a45cdbb0f.jpg)
![typography brochure data visualisation data visualization editorial graphic design infographic information design Layout map](https://mir-s3-cdn-cf.behance.net/project_modules/1400/822641359139.6545a45cd9f85.jpg)
![typography brochure data visualisation data visualization editorial graphic design infographic information design Layout map](https://mir-s3-cdn-cf.behance.net/project_modules/1400/d07f03359139.6545a45cdd806.jpg)
![typography brochure data visualisation data visualization editorial graphic design infographic information design Layout map](https://mir-s3-cdn-cf.behance.net/project_modules/1400/22ba08359139.61b3e4ab0342f.jpg)
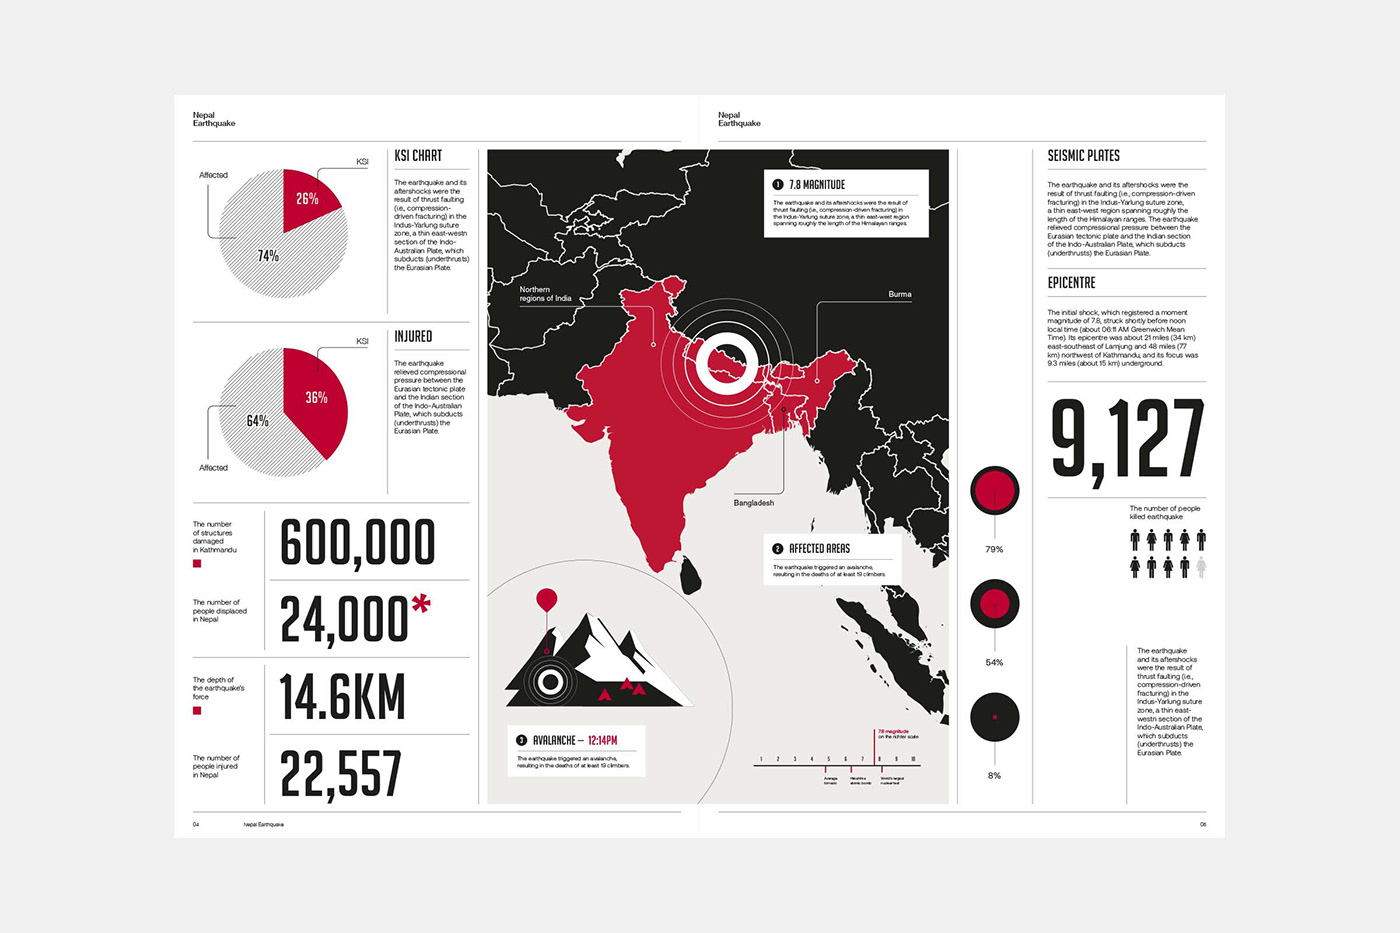
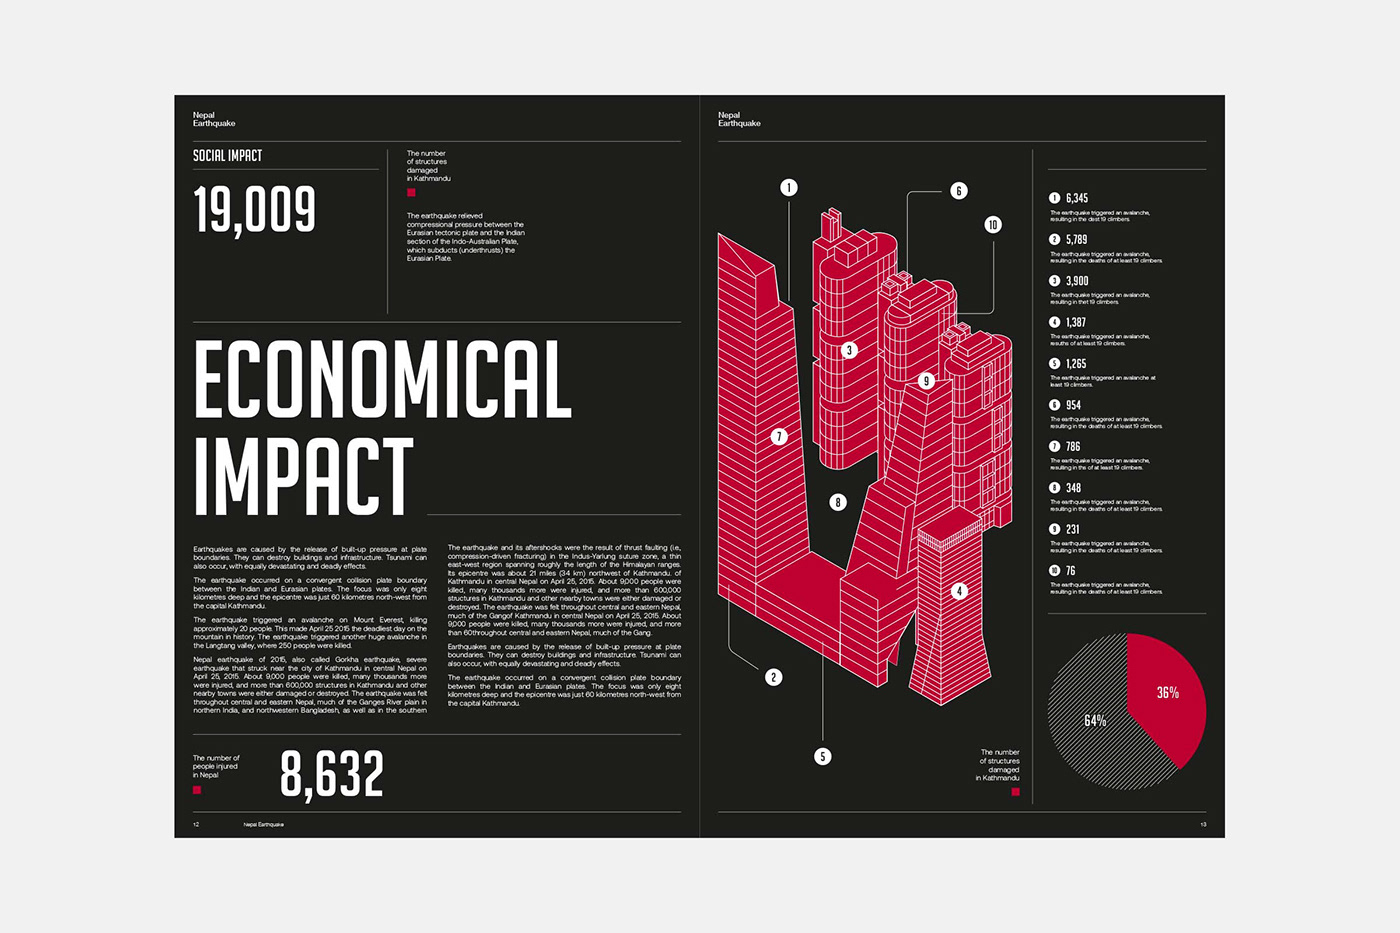
The Nepal earthquake, also called Gorkha earthquake, struck near the city of Kathmandu on April 25, 2015. I designed a series of layouts using infographics to communicate the events and translate large data sets and metrics into charts, maps, graphs and various graphical representations.