IOS 12
Screen Time
Data Visualization
- Experimental Project
Screen Time, the new feature of IOS 12, which records the data which app takes up on the screen time of your phone.
This is a very interesting statistic. I tried to record the screen time data of my iphone, and make a data visualization experiment to see how the apps in my mobile phone fight for the screen time .
This is a very interesting statistic. I tried to record the screen time data of my iphone, and make a data visualization experiment to see how the apps in my mobile phone fight for the screen time .
Tools : Processing, Cinema4D, After Effects, Houdini, Octane Renderer
Time : April 22 - 25, 2019
Time : April 22 - 25, 2019

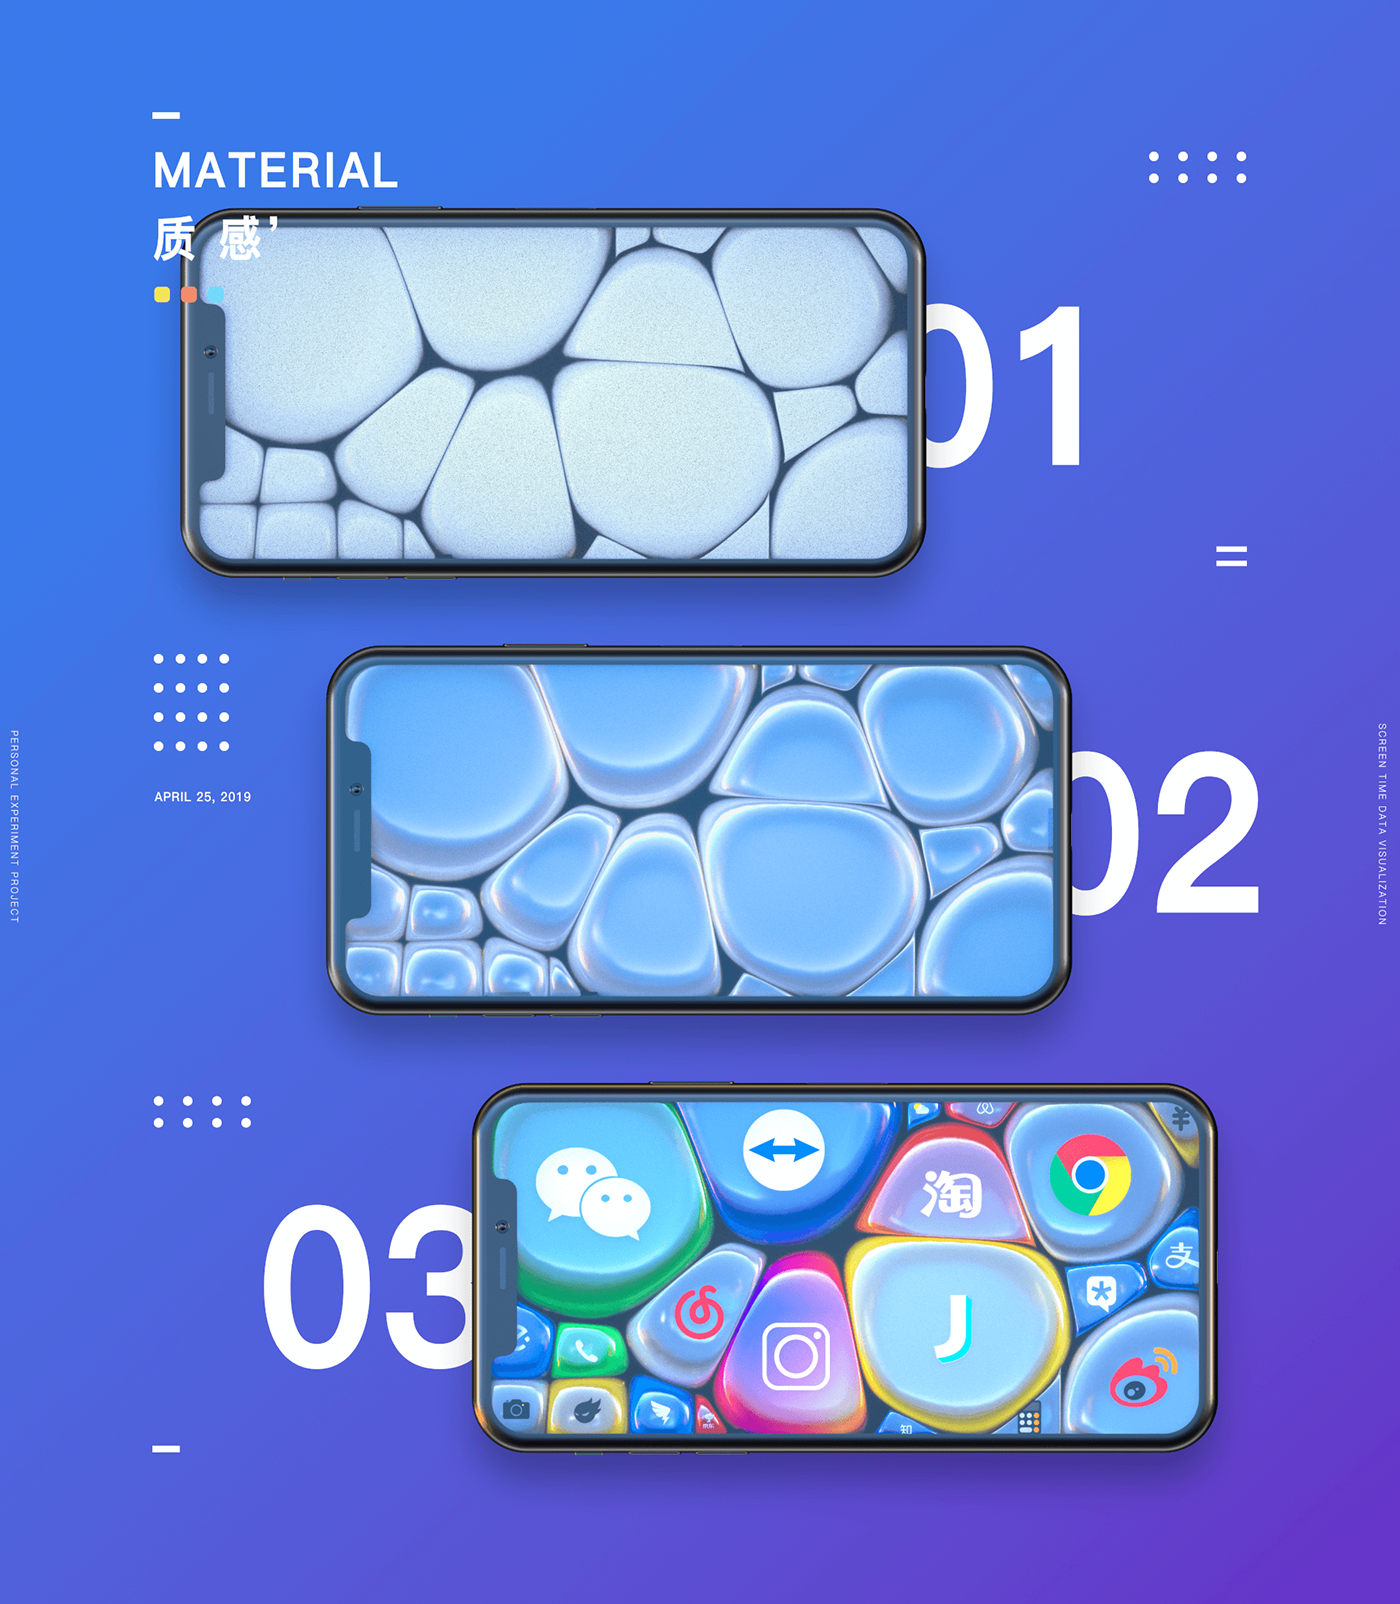
- Visualize Data in 2D Space with Processing.
Processing processes the screen time data, and generates multiple K-D Tree structures in which different apps occupy different areas according to their screen time.

- Visualize Data in 3D Space with Houdini.
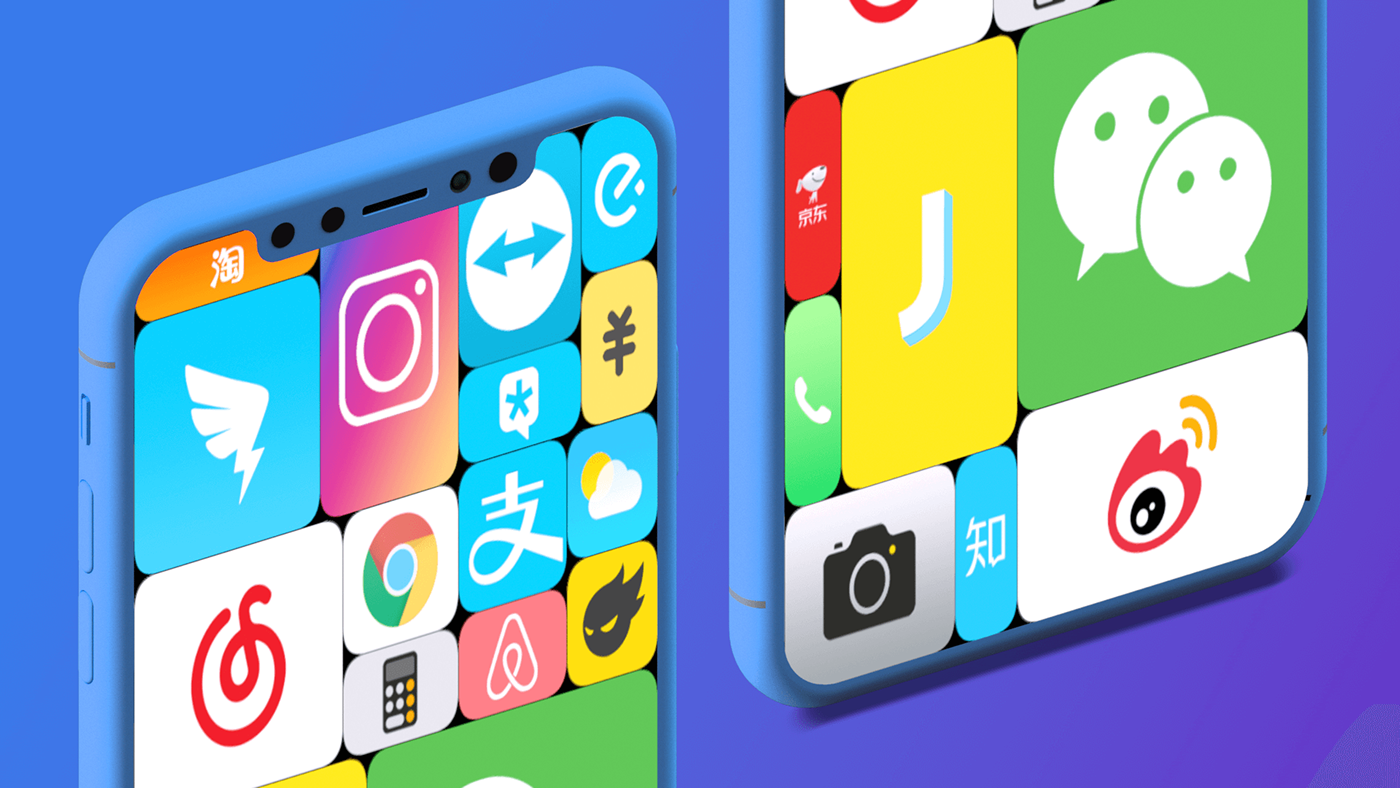
I decided to use some soft spheres in Houdini to express the relationship between different applications. They scales, moves and squeeze each other based on the screen time data over the time.


- Visualization of Different Occupational Groups.
As the experiment progressed, I found that the screen time data for different people was quite different.
Workaholics' screen time is occupied by WeChat, DingDing and other communication applications; The screen time of designers may includes Behance, Pinterest, Zcool; And for the elders who just touched the smart phone, screen time may only be occupied by Wechat with which they communicate with their children.
The daily preferences and habits of different individuals are hidden in the screen time data.